
Hullabaloo over Marginal Tax Rates
With all the media hype and congressional drama, those of us who pay only superficial attention to the underlying issues might think that US national fiscal policies were in for a dramatic shift. My teenage daughter, visiting us for the holidays, confessed that she was perplexed and failed to understand what all this fuss is about. Guess she could not stand watching her parents ignoring her in favor of Ali Velshi and Fareed Zakaria!To be fair to my daughter, a sophomore political science major at George Washington University, I decided to take a broad look at what appeared to be the most contentious issue at hand: the marginal federal income tax rate. I went beyond the sound-bites and distilled statistics that are always presented with a slant of some interest group and looked at historic records on marginal tax rates. And I realized that she is right. All this hungama was much ado about nothing- well, almost nothing.Considering that Indian Americans are one of the most affluent ethnic groups in the United States and that we are poised to show up at the national stage (thanks to Indiaspora), I thought that I would share my analysis in this blog. Being an engineer, I sought out raw data and found this at https://taxfoundation.org, dating back to 1913, when the first permanent federal income tax was established. The chart below, mapping tax brackets against marginal rates, took me a while to build and shows the spread over the past century. Let’s take a close look at our 100-year federal income tax history and drill down to what’s at the center: the “2012 fiscal cliff battle.” 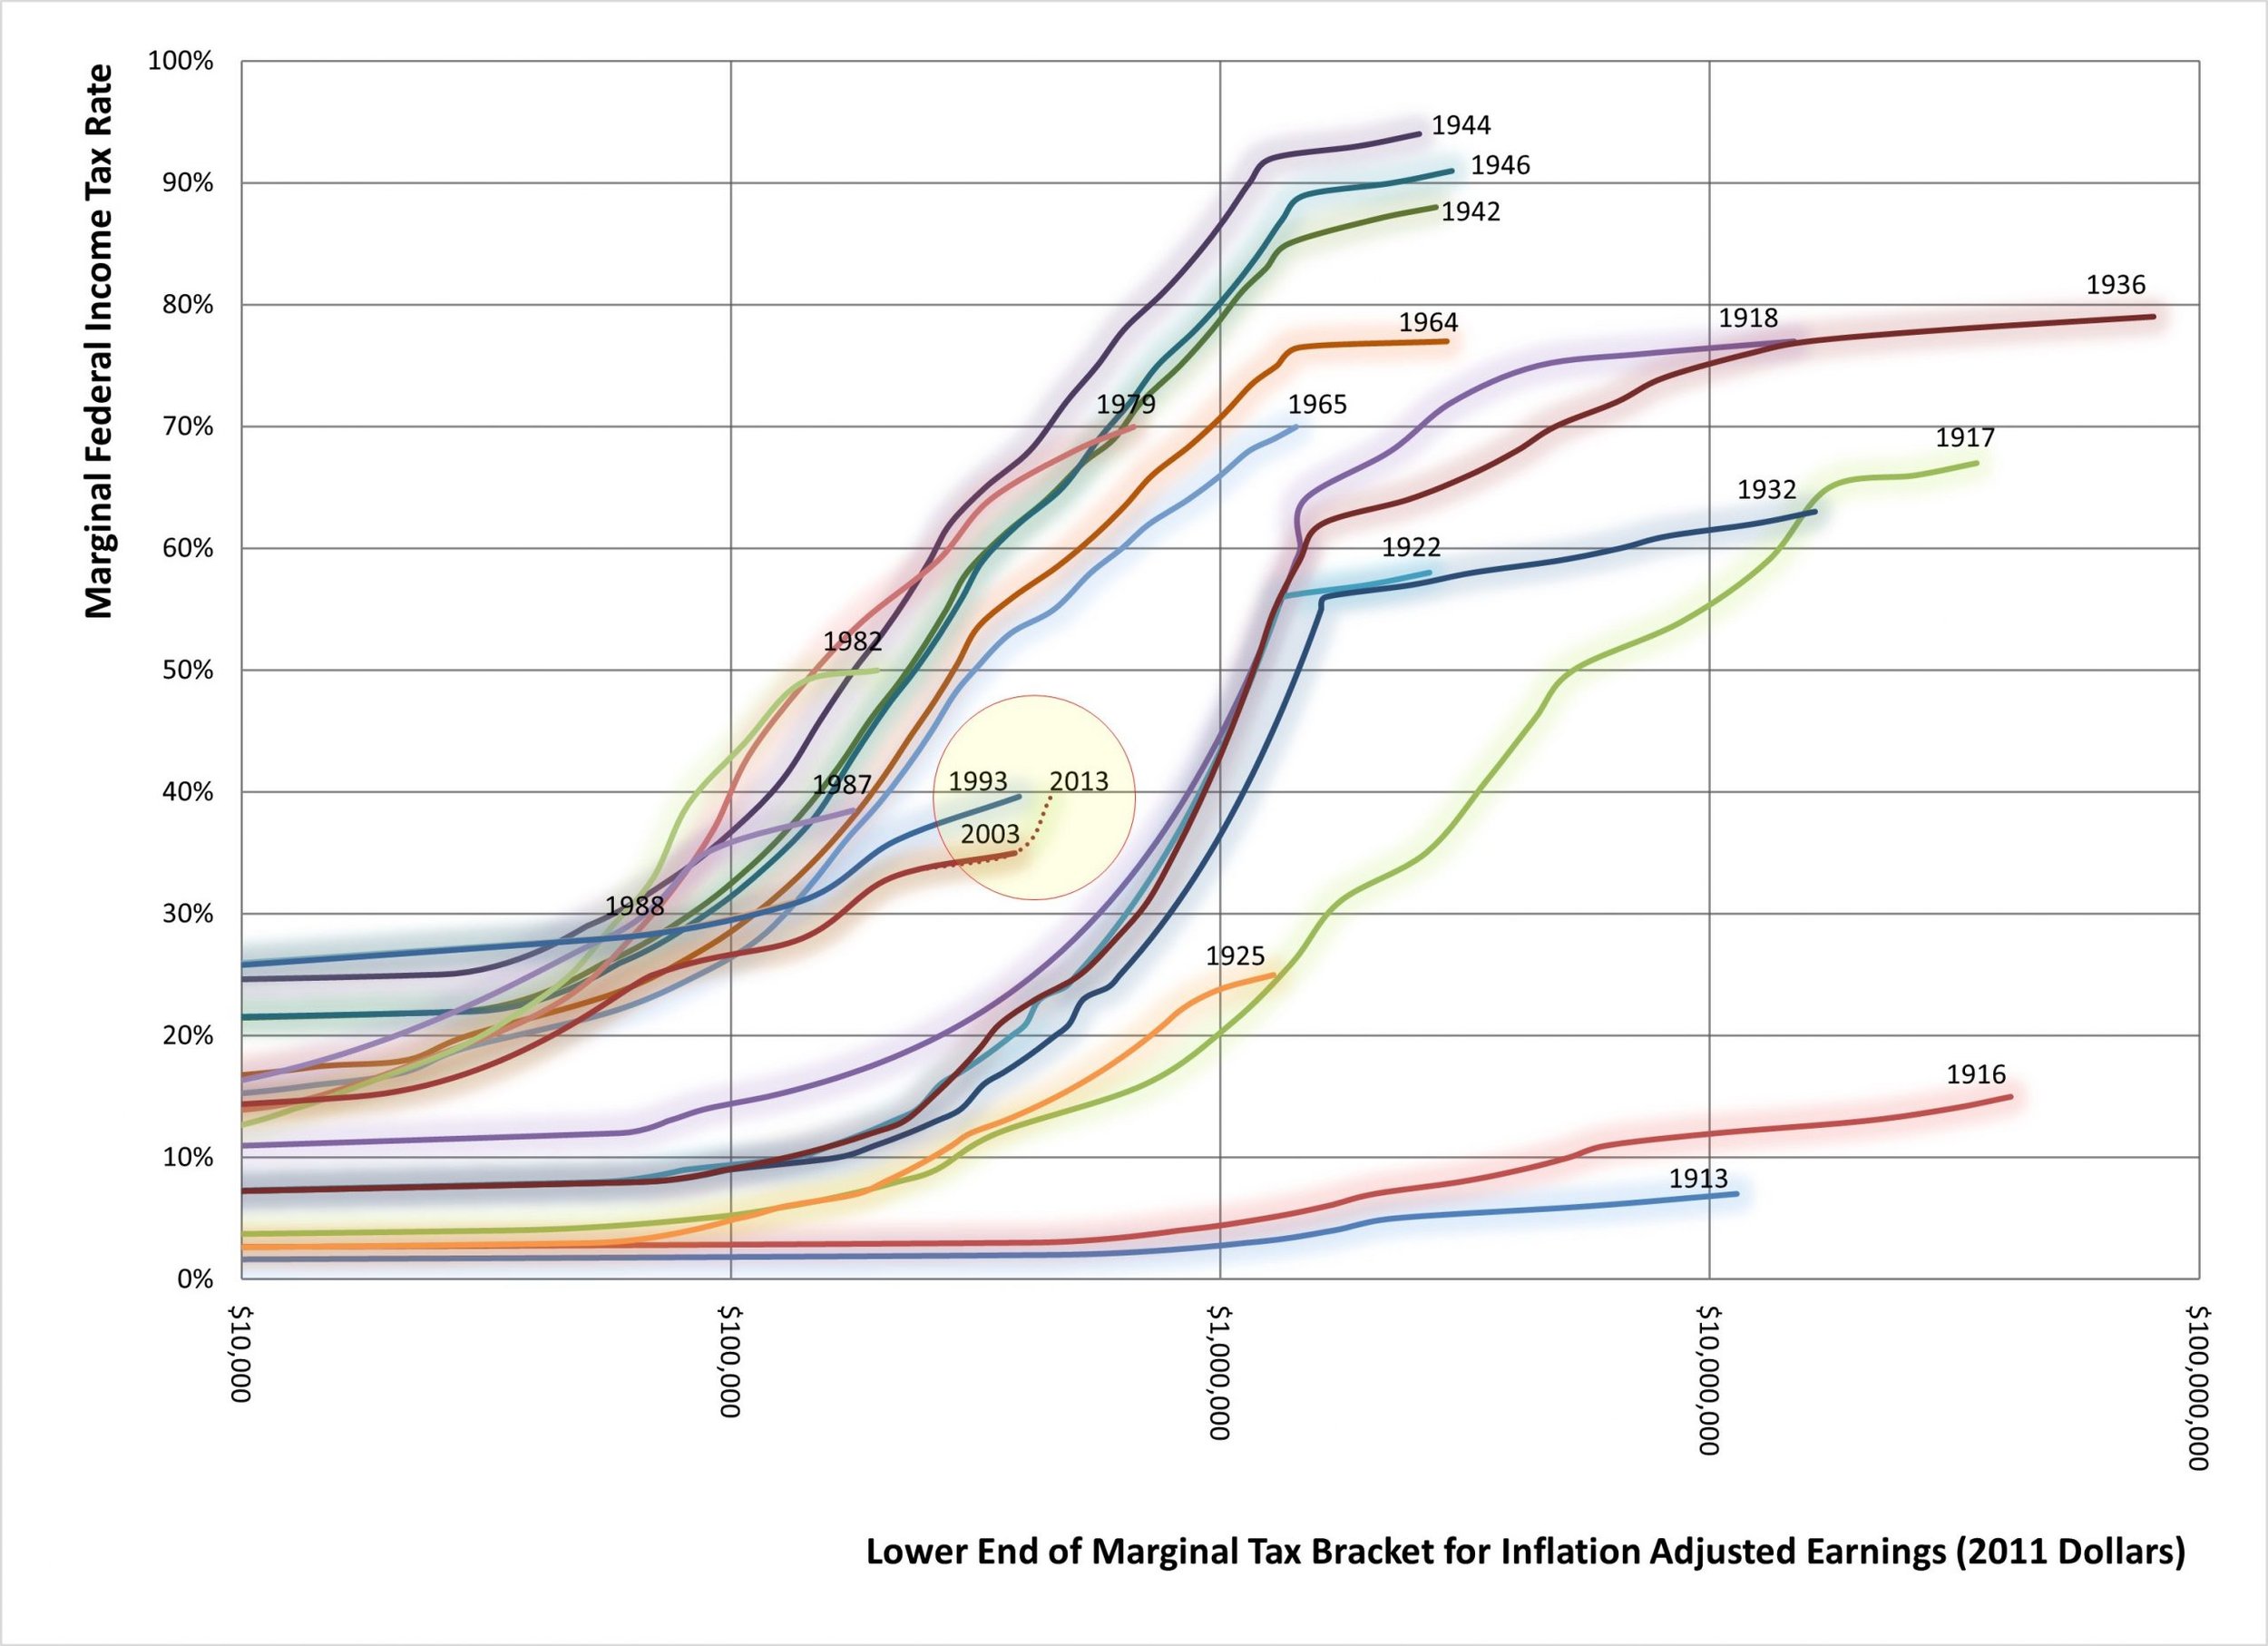 The first marginal tax rates in 1913 ranged from 1% to 7%, compared to the new 2013 rates of 10% to 39.6%. Back then, top marginal rates were defined for income brackets over $11 Million (I’m using 2011 dollars here and below, adjusted for inflation using the Consumer Price Index), whereas today’s debates focus on the upper-end tax bracket ranging from $0.25 MM to $1 MM. If you step back and look at the chart, it is clear that prior administrations dealt with far more dramatic changes to the tax code than we could imagine today (note that I used a log scale for the X-axis). Let’s explore some of these changes and the factors that drove them.The first big tax changes came between 1916 and 1918. The highest marginal tax rate jumped from 7% in 1913 to 77% by 1918, to pay for World War I. In 1918, the tax code had 56 income brackets, compared to the 6 we have today. The first extended tax-cuts came after WWI, in 1922 and 1925, when top marginal rates were reduced from 77% to 58% and then to 25%.The second jump in federal taxes came after the great depression, with the top tax bracket in 1936 at 79% for family earnings over $80 MM (again, in 2011 dollars). World War II followed and, as old fashioned America, we chose to pay our bills and increased marginal rates further, while dropping the income brackets. By 1944, the top rate was 94% for family incomes over $2.5 MM.We maintained a marginal tax rate of 91% from 1946 to 1963 and Republican President Eisenhower used high taxes to rebuild America and pay for the Korean War in the 1950s.The first war-time tax reduction was in 1964 and 1965, when President Johnson fulfilled the 1963 promise of President Kennedy and cut top rates by over 20%. The resulting brief expansion supported those who argued that cuts in tax rates would stimulate growth, reduce unemployment, and generate higher revenues.Budget deficits continued to build through the 1970s - which President Reagan would eventually blame on Keynesian (demand-side) fiscal policies. President Reagan presided over even more aggressive tax cuts, with the top rate dropping to 38.5% and the top bracket dropping to less than $200K by 1987.The watershed year was 1988, when we had only two marginal rates, 15% for family earnings below $56K and 28% for those above. Between 1988 and 1991, families earning less than $60K paid the same marginal rate as families earning over $60MM; compare this to 1936, when the marginal rate for the former was 8% and the latter was 78%! For better or worse, the country had embraced the trickle-down (supply side) theory of economics.During this period, the Republican President’s priority to dramatically increase military spending clashed with the Democratic Congress’ priority to increase spending on social programs. They compromised: both sides won and we began our history as Credit Card Nation, paying little attention to the exploding annual deficits in the 1980s.The political perils of departing from the supply-side philosophy of the 1980s were illustrated when the modest deficit reduction attempts of President Bush Sr. led to his single term in office. All he did was to add a third marginal tax rate of 31%, to deal with the piling deficits compounded by the Gulf War of 1990-91 and the recession. For the first time in US history, we the American electorate sent a strong message in 1992 that it was not willing to pay for Wars and Economic downturns, instead passing these costs to future generations.President Clinton’s attempts at further deficit reduction through tax increases fared better, thanks to the economic bubble fueled by Information Technology and Real Estate growth in the 1990s. His tax increases were also modest in perspective, adding two marginal rates (36% and 39.6%) and two brackets ($217K and $388K, in 2011 dollars).In the 21st century, our federal fiscal policies took another subtle turn (for the worse, from the deficit perspective). Despite dramatic escalations in military expenditures due to the wars in Iraq and Afghanistan, President Bush Jr. re-enacted the war-time tax reduction policy of President Johnson. But this came without any of the concurrent Keynesian social spending, as trickle-down economics was a lot more entrenched and institutionalized by now.Of course, his change was subtle, reducing the top rate from 39.6% to 35%. Deregulation of the financial, insurance and real estate sectors by Presidents Clinton and Bush Jr. came home to roost, resulting in the financial crash of 2008. In response to the resulting 2008 recession, taxes were not raised, but domestic spending was increased as a “stimulus”, while war cost from Iraq and Afghanistan continued to pile up.According to the Social Security Administration, we now live in a society where the top 1% of taxpayers earn as much as the bottom 48% (13% each). According to the Pew Research Center, Indian American median income is $88K/yr (in the top 10% of households) and 38% of us have advanced college degrees. Will we put our wealth and knowledge to good use? Will be speak up for the larger social good on fiscal issues or remain silent, to preserve our self interests? Which brings us to the dramatic Senate session on New Year ’s Eve and the House session on the eve of the 112th Congress last day. All we got in the tax deal was another marginal rate of 39.6% for family earnings over $450K (that’s the short dotted line highlighted in the chart).While Congress and the White House are rearranging the deck chairs on the Titanic, domestic infrastructure continues to crumble (with no political will to invest) and deficits continue to skyrocket (with no political will to raise revenues or reduce spending). Fiscal dialogue is clouded by mixing the trust fund (for Social Security and Medicare) with the annual operating budget, blurring the line between obligatory and discretionary federal spending. Tax dialogue is clouded by the proliferation of deductions, credits and rebates to fund special interests, letting this politically charged “noise” mask the dire need for meaningful reform.The party that lobbies strongly for tax cuts is also the one lobbying for increased military spending, which brings me to the last subject of this blog. President Dwight Eisenhower’s predictions about the Military Industrial Complex appear to have come true. If we separated trust fund expenditures from operating budgets, military expenditures have remained at over 50% of discretionary federal spending since the 1960s and remain practically unchallenged to any significant extent by both major political parties. In a 2010 Congressional Research Services report, defense policy expert Stephen Daggett summarized direct military costs (note that his analysis did not include veterans benefits, interest on war related debt or assistance to allies) in 2011 dollars (Cost of Major US Wars). The military costs of wars since 1990 add up to over three times the total costs of all wars from 1775 to 1940. To add to this, we did not raise taxes to pay for the recent wars.Over 85% of Indian-American adults today were born outside the US. Much of the wealth Indian Americans have created for themselves is not contingent upon the continuing prosperity of the military industrial complex. This should allow us to bring an objective mind and fresh perspective to the subject of congressional approval of guns, tanks, planes and ships that the military did not ask for. Can we help shift the spending dialogue away from the red herrings and move the national security dialogue to Smart and Soft American power projection, or will we remain silent?There is no question that all the recent political drama surrounding fiscal issues has little relevance to addressing long-term deficit issues. In the recent publication on Social and Demographic trends, the Pew Research Center indicated that 78% of Indian Americans identify that being a good parent is one of the most important things in our lives. Will we do what it takes to bequeath a better future to our children? Will we get politically active? And, can we address issues without getting partisan, although 65% of us are registered as or lean Democratic?
  An environmental engineer, Dr. Raj V Rajan has spent over three decades reducing the private sector’s energy and water footprint through independent consulting, startups and executive leadership role in a multinational corporation. He is active in global industry groups focused on climate change and water pollution; has served as an advisor in several public sector international and national guidance, research, and teaching institutions; serves on the Boards of several non-profits shaping the region’s clean energy and environmental policies; and was appointed by successive Minnesota Governors to the Minnesota Clean Water Council. Guided by a strong belief that shaping collective human behavior is more important than just developing technological solutions, he supports promoting the humanities through visual and performing arts to deliver social and environmental change. You can follow him on Twitter and LinkedIn.